# Boston Neighborhood Map: Why Does Allston-Brighton Sit Apart From the Rest of the City?
Key Takeaways
•The short answer: On a Boston MA neighborhoods map, Allston-Brighton stands apart because it combines one of the city's lower entry points with some of its strongest rental demand.
•The evidence: The city's Jackson Mann study put the neighborhood's rental vacancy rate at 0.5% or less as of August 2025, so apartments rarely sat empty.
•The opportunity: Boston condos have 10.5 months of supply (how long it would take to sell every listing at today's pace) citywide, according to MLSPIN data via Repliers. Buyers have time and room to negotiate this fall.
•The bottom line: Buy here for long-term stability, ideally a home you live in and partly rent out. Do not buy here for a quick flip.
Does a Boston Neighborhood Map Really Go From Cheap to Expensive?
Most people read a Boston neighborhood map like a price ladder. They expect cheaper areas to sit far from jobs, transit, and nightlife. They expect high-rent areas to carry high purchase prices.
Allston-Brighton breaks that pattern.
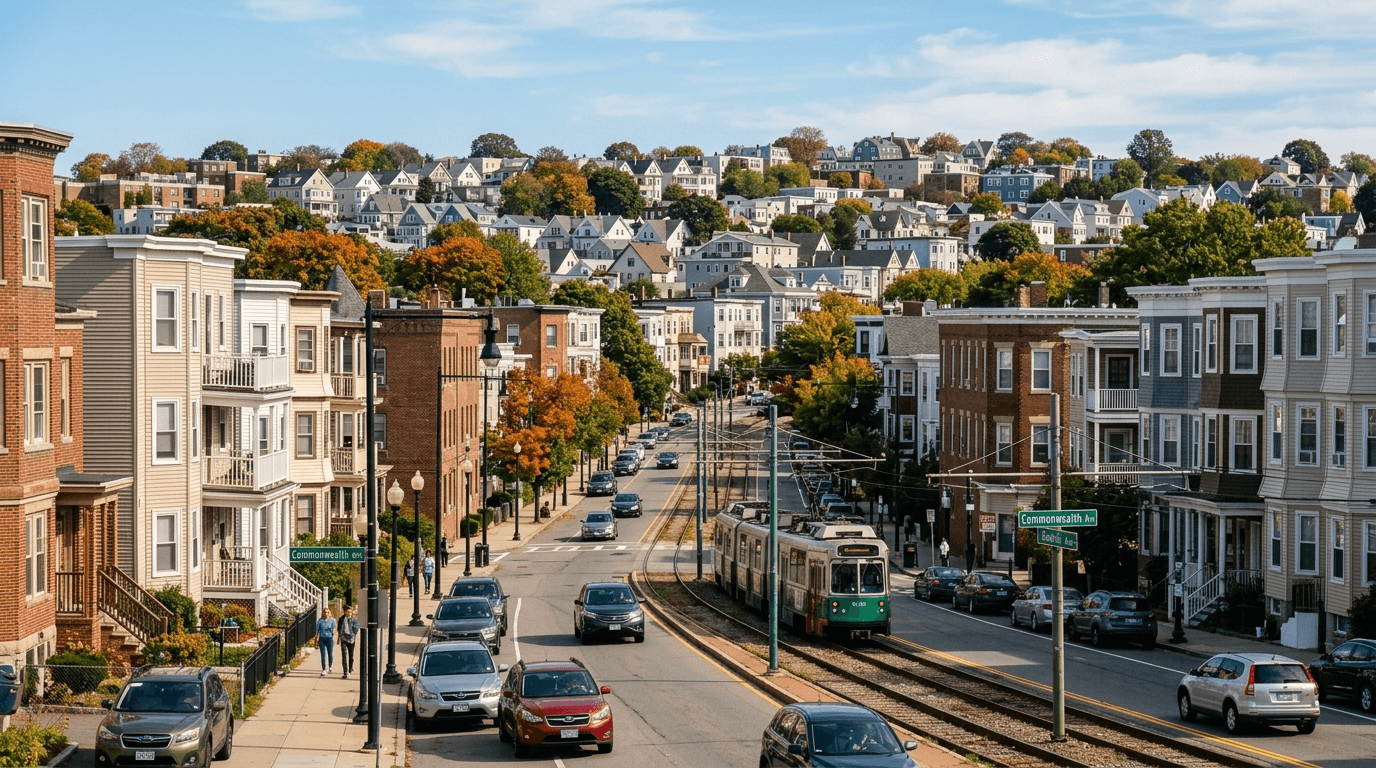
It is Boston's western wedge, tucked against Brookline and Newton, with Cambridge across the river. It feels like its own town but sits inside city limits.
You can often buy in for less than in many central neighborhoods. You still get city-level rental demand from students, hospital and tech workers, and transit riders. For a long-term buyer, that mix can make the buy-versus-rent math work better than it first looks.
Why Do Prices Stay Lower While Rents Stay High in Allston-Brighton?
Centre Realty Group names Brighton, along with Hyde Park and parts of Dorchester, as one of Boston's "entry points" for buyers. That means the cost to get in can be lower, not that homes are cheap.
A big reason is housing type. Allston-Brighton has many condos and older multi-family homes. These give buyers more ways in than neighborhoods dominated by luxury condos or single-family homes.
Tenants pay for a different set of benefits:
•Easy transit. Green Line trolleys, commuter rail, and buses reduce the need for a car.
•Food and nightlife. The main commercial streets offer restaurants, bars, and daily services.
•Steady demand. Nearby universities, hospitals, and tech employers keep renters looking year-round.
The city's Jackson Mann Housing with Public Assets Study put Allston-Brighton's rental vacancy rate at 0.5% or less as of August 2025 and found that 90% of Allston residents rent.
Allston-Brighton Market Demand and Vacancy Signals
Selected vacancy and renter-share indicators from the Jackson Mann Housing with Public Assets Study.
| Category | Vacancy / share |
|---|---|
| Rental vacancy rate (August 2025) | 0.5% or less |
| Retail vacancy rate (Q2 2025) | 2.6% |
| Urban Ring West office vacancy (Q2 2025) | 5.6% |
| Boston overall office vacancy (Q2 2025) | 17.7% |
| Allston renter share | 90% of Allston residents are renters |
| Brighton renter share | 76.5% of Brighton residents are renters |
That cuts both ways. In Allston, 90% of residents rent; in Brighton, 76.5% do. That suggests many 2- and 3-family buildings are rented out, so homes set up for an owner to live in are scarcer. If you buy a multi-family from an investor and live in one unit, you become one of a few owners in the building. Tenant demand stays deep, and rent from the other units can help carry the mortgage.
One rule change matters for your budget. According to NBC Boston, a Massachusetts law that took effect Aug. 1, 2025 requires whoever hires a broker to pay that broker's fee. If you hire a leasing broker to find tenants, plan for that cost.
Isn't Allston-Brighton Just a Student Rental Market?
Students are a major part of the rental market, but not all of it.
Boston.gov has reported work on the Allston-Brighton Community Plan and new zoning for 2026, focused on more affordable housing and better open space. Nearby, Beacon Park Yard and Harvard's Enterprise Research Campus are expected to add housing, jobs, and transit improvements.
Those projects add both renters and rental units. The jobs support demand, but the new housing could slow rent growth. Treat rental income as help with the mortgage, not a promise of yearly increases.
Is Allston-Brighton a Real Bargain or a Trap?
"Is the price gap just a housing-mix illusion?"
Partly, yes. Brighton's entry-point status reflects its many condos and older multi-family homes, so it is not a like-for-like comparison. Boston's citywide condo median was $790,000 in July, per MLSPIN data via Repliers. Use that as a ceiling check, not proof that Allston-Brighton is cheaper.
What this means for you: compare recent nearby condo sales and similar multi-family homes before making an offer.
"Are prices about to fall?"
The sales pace has slowed. According to MLSPIN data via Repliers, Boston condos had a median of 45 days on market (how long a home is listed before it goes under contract) in July, versus 34 for single-family homes.
Reference Real Estate cited Redfin data putting Boston's median sale price at about $806,000 in April, down 5.7% from a year earlier. A further short-term dip is possible.
Slower sales and softer prices give buyers bargaining power. They reward patience, which fits a long-term plan.
What this means for you: negotiate hard and assume your home could be worth a bit less in a year. Only buy if you plan to hold for many years.
"Does cheaper mean worn out?"
Not automatically. Many buildings have been renovated, and tree-lined side streets offer real curb appeal. But condition varies building to building.
A low tax assessment doesn't tell you a building's condition or sale value. Rely on the inspection and recent nearby sales.
Boston Agent Magazine reports that since Oct. 15, 2025, Massachusetts sellers cannot condition a sale on a buyer waiving or limiting a home inspection. That protects you. Use it.
What Do the Latest Boston Market Numbers Mean for Fall Buyers?
As of early October 2026, July's MLS numbers favor buyers.
MLSPIN data via Repliers shows Boston condos at 10.5 months of supply citywide in July, compared with 5.6 months for single-family homes.
Boston Market Snapshot by Property Type (July 2026)
Current MLS-based pricing, inventory, and speed metrics for Boston single-family, condo, and mixed property segments.
Single-family
Median sold price$1,107,500
Months of supply5.6 months
Median days on market34 days
Condo
Median sold price$790,000
Months of supply10.5 months
Median days on market45 days
Mixed
Median sold price$879,500
Months of supply9.7 months
Median days on market43 days
Source:Repliers / MLSPIN
A higher number gives buyers room to slow down, compare options, and push on price. Neighborhood conditions can differ, so ask your agent how many comparable Allston-Brighton listings are active.
High mortgage rates make buying harder. Freddie Mac's weekly survey put the 30-year fixed rate at 7.28% as of Oct. 1, 2026. At that level, rent from a second unit matters even more.
Boston Agent Magazine reports that the last week of October is often the best time to buy in Boston. With this much supply, treat that as a good window to negotiate, not a deadline.
What Should Allston-Brighton Buyers Do Now?
If your goal is quality of life and long-term stability, Allston-Brighton deserves a serious look. It is one of the rare Boston neighborhoods where entry price, rental demand, transit, and dining line up.
Here is your next move:
•Refresh your pre-approval at today's rates.
•Focus on multi-family homes you can live in or well-run Brighton condos.
•Run the math on lower rent. Use a rent below current asking, subtract any leasing broker fee, and buy only if the mortgage still works.
•Take your time. With high condo supply, compare several listings before you offer.
•Keep your inspection rights and price repairs into your offer.
•If you have kids, check school options early.
•Track the 2026 Community Plan and zoning drafts, which may shape what gets built nearby.
The neighborhood that looks "out of order" on the Boston neighborhood map may be one of the city's better long-term values this fall. To compare it against Brookline, Newton, Cambridge, or another neighborhood, start with actual sales in your price range, not the map alone.